Michelin’s star rating is considered one of the most prestigious awards that a restaurant can receive. We analyzed Michelin’s star ratings and billionaires, by urban area, to try to understand where the world’s wealthiest are served with fine dining and where they are not. You can interact with our visualizations below or watch Tom explain our analysis here (3-minute video).
Read MoreBlog
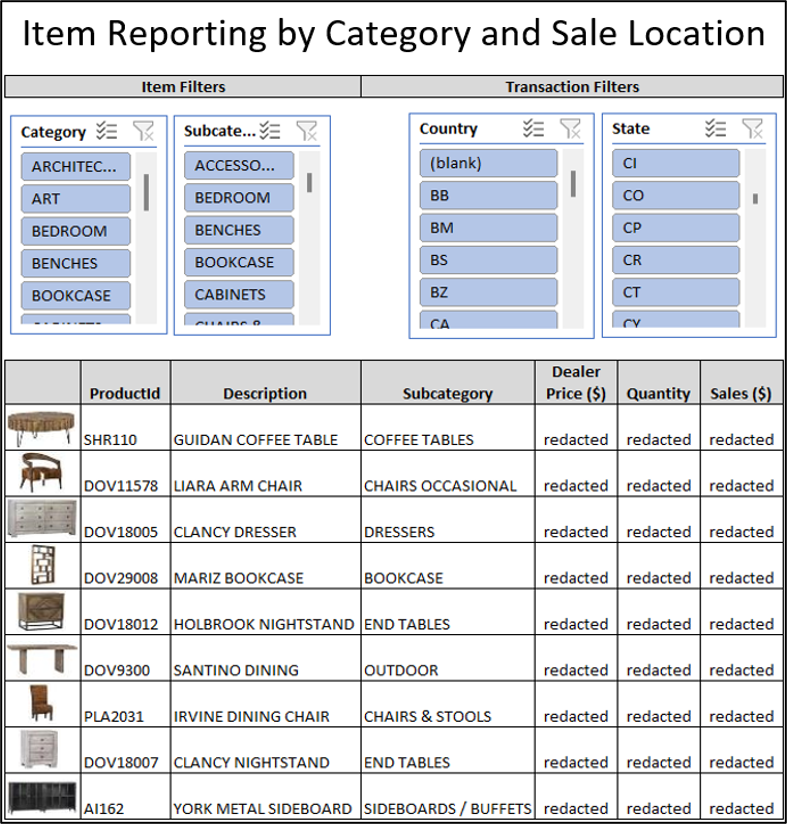
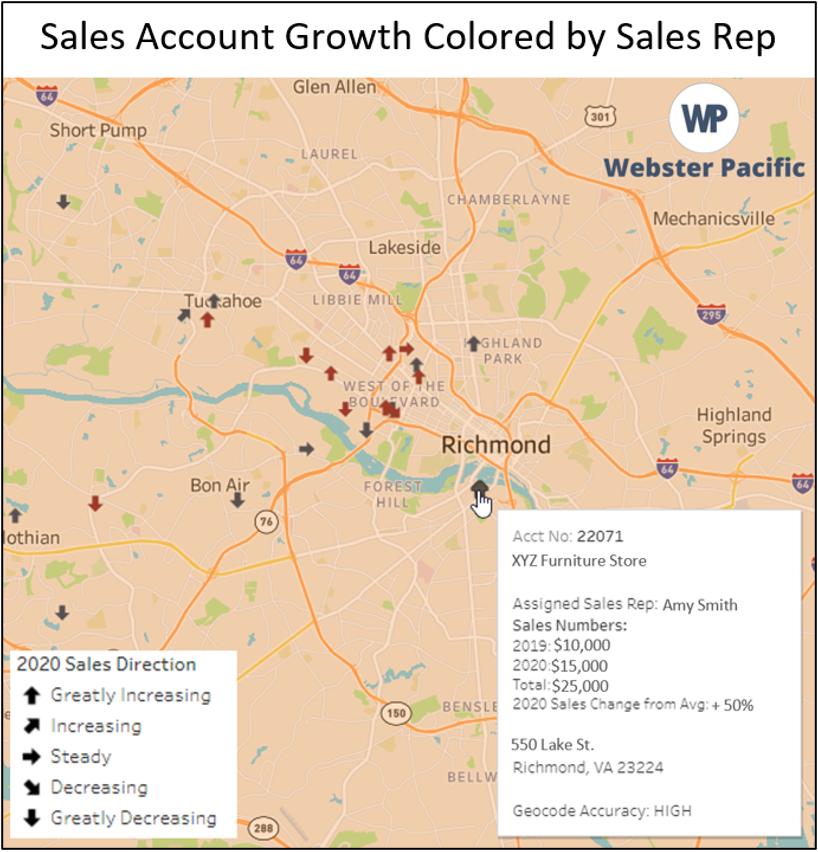
Dovetail Furniture and Designs, a Webster Pacific (WP) client since 2019, is a B2B designer and reseller of lifestyle furniture based in Los Angeles. The CEO, Marco Petruzzi, is an ex-Bain partner who joined Dovetail in 2018 to increase sales and profitability and overhaul their physical and technology infrastructure. Marco appreciates working with analysts that can make short work of thorny Excel problems, as well as going beyond spreadsheets to assist in the technical complexities of an ERP database migration.

Over the past two years, WP has helped Marco with multiple projects including: 1) identifying sales territories with room for growth, 2) developing purchasing models to monitor their supply chain, 3) building P&L models for an acquisition, and 4) cleaning massive inventory and financial datasets for an ERP migration.
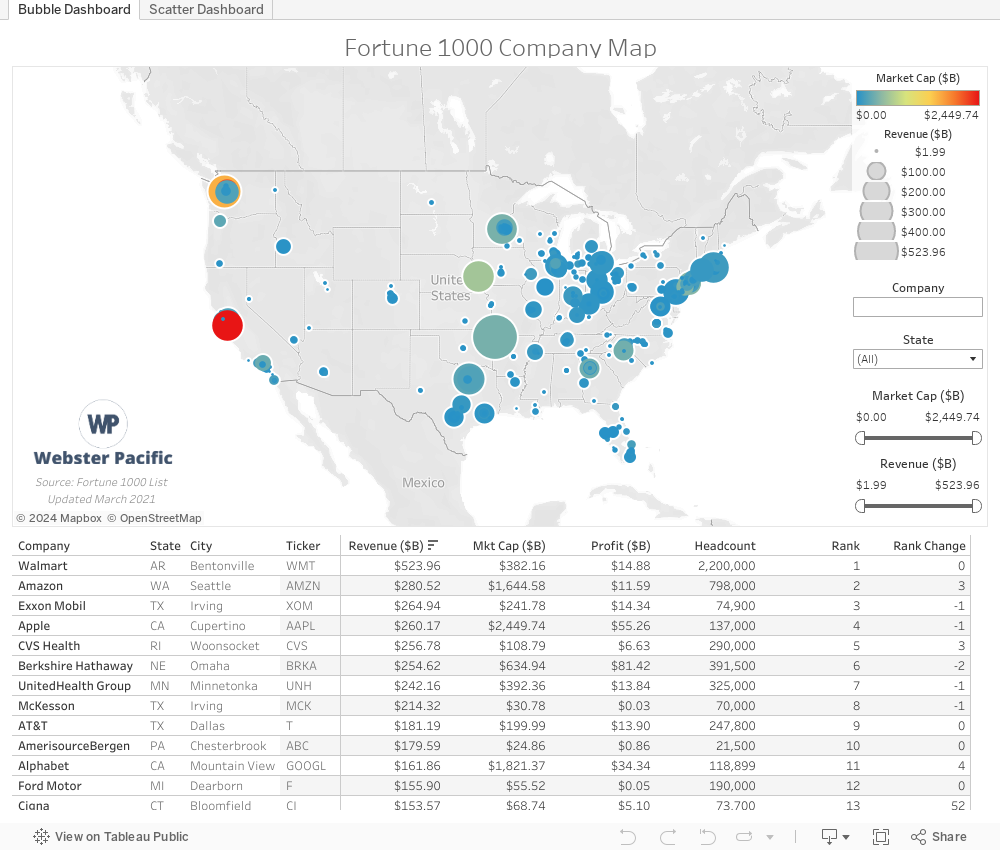
Fortune defines America’s largest 1000 public companies by their revenues, but companies can be defined and ranked by many other metrics, including market cap, profit, and employee count.
We analyzed and created visualizations of the Fortune 1000 list, which you can interact with below or watch Steve explain here (3-minute video).
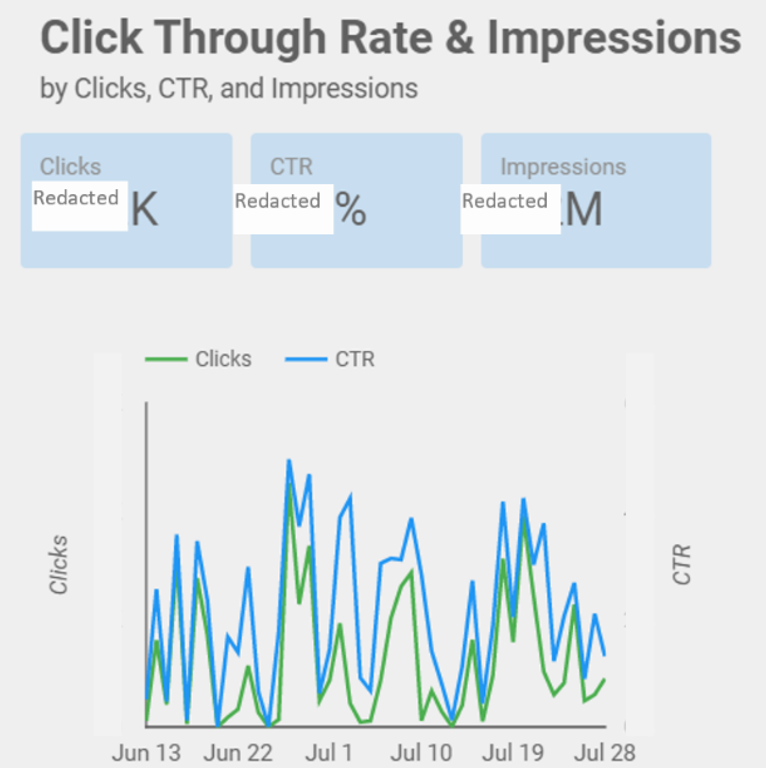
Paid marketing is a powerful tool to expand your business and get new customers, but how do you evaluate which campaigns and platforms are the most effective? We created a dashboard that collects the most relevant metrics across all of your paid marketing platforms (Google, Facebook, LinkedIn, etc.) so you can measure your campaigns and know where to invest more.
Click here to watch Steve explain the dashboard in one minute or interact below with the dashboard yourself.
Read MoreAlex Crane, a WP client since 2019, is a “breezy” linen clothing brand based in Brooklyn. The founder, Alex, and his COO Aaron have grown the Alex Crane brand over 300% YOY for the past 3 years straight. They’ve been able to maintain this impressive growth and stay profitable by staying lean in terms of employee count. As with any small and rapidly growing company, there are plenty of analytical questions to answer, but the size of their business does not warrant a full-time hire to address those questions just yet. That’s where Webster Pacific comes in.
Over the past two years, WP has helped Alex and Aaron answer a variety of questions across marketing, operations, and finance. A few noteworthy projects include: 1) predicting inventory to avoid stockouts, 2) implementing attribution models to optimize marketing spend, 3) finding new wholesale accounts to grow their revenue, and 4) planning their cash flow to maintain the financial health of the brand.
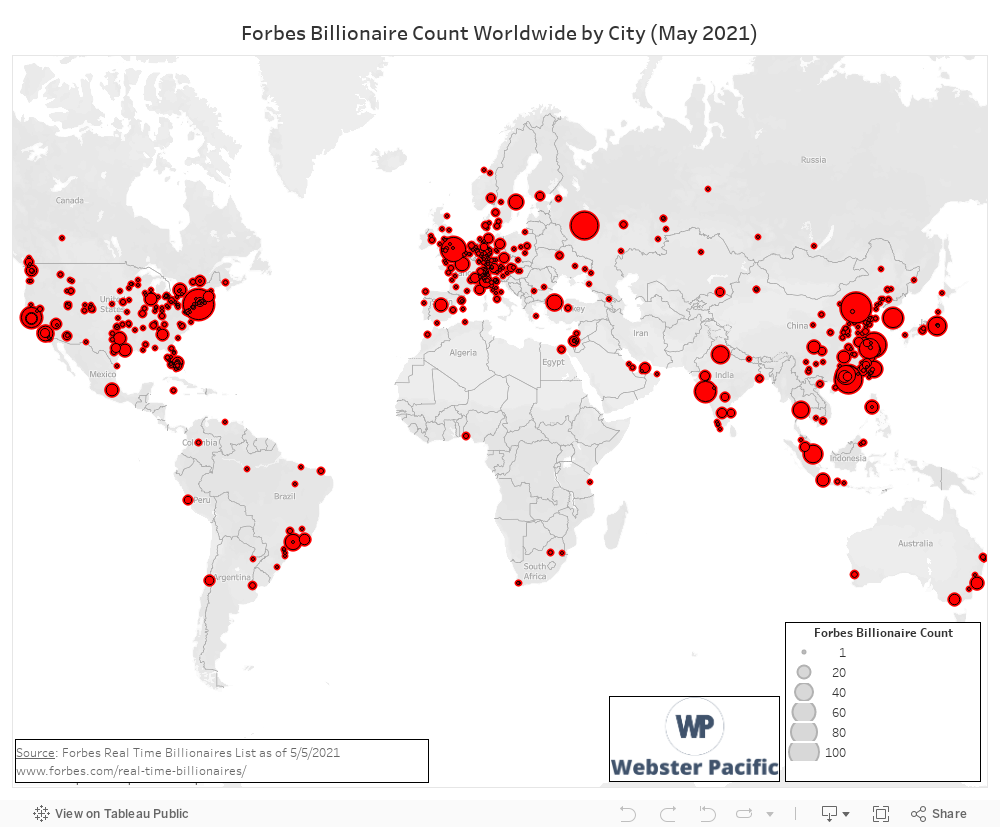
Wealth, like so many other metrics, can be defined in multiple ways, including households earning more than $200k+, High Net Worth Individuals, Ultra High Net Worth Individuals, and Billionaires. Using the Forbes Billionaires List, we mapped the city of residence for all of the ~2,700 global billionaires . You can interact with the data below and view a 3-minute video of Tom and Steve explaining the data here.
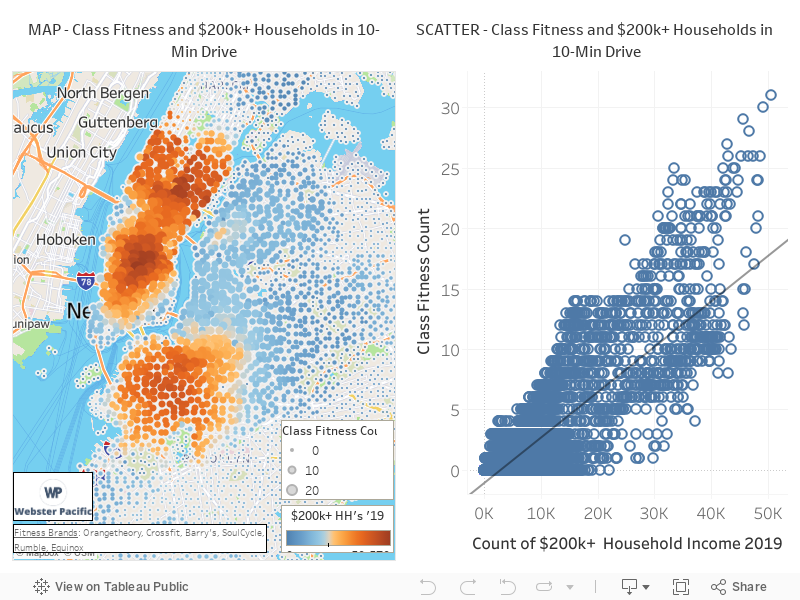
As vaccines roll out and consumer confidence grows, we expect to see a significant return to in-person class fitness. To that end, we wanted to study which data is predictive of existing fitness studios like SoulCycle and Crossfit. To do so, we collected Census data within a 10-minute drive from thousands of points in NYC and regressed it against the number of studio fitness locations. Of the 50+ variables studied on population, occupation, education, and income, we found that the number of $200k+ income households had the strongest correlation to number of fitness studio classes, with an r^2 of 0.66.
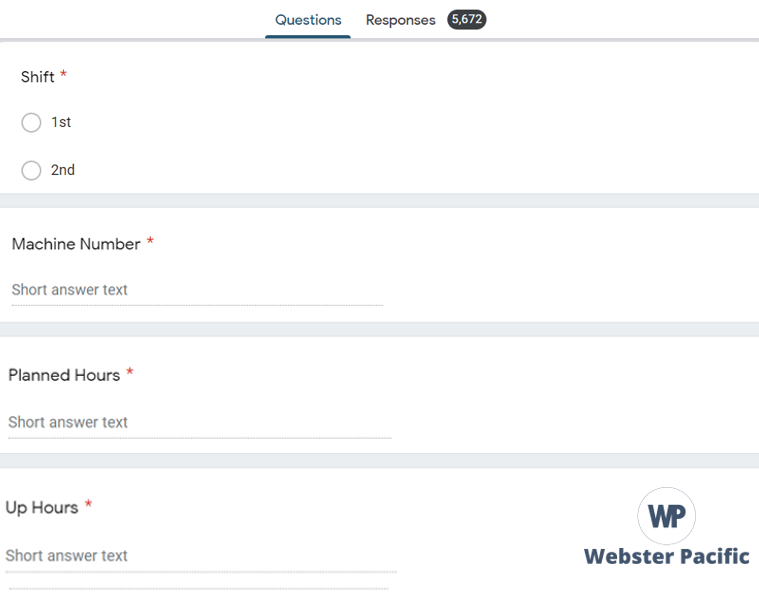
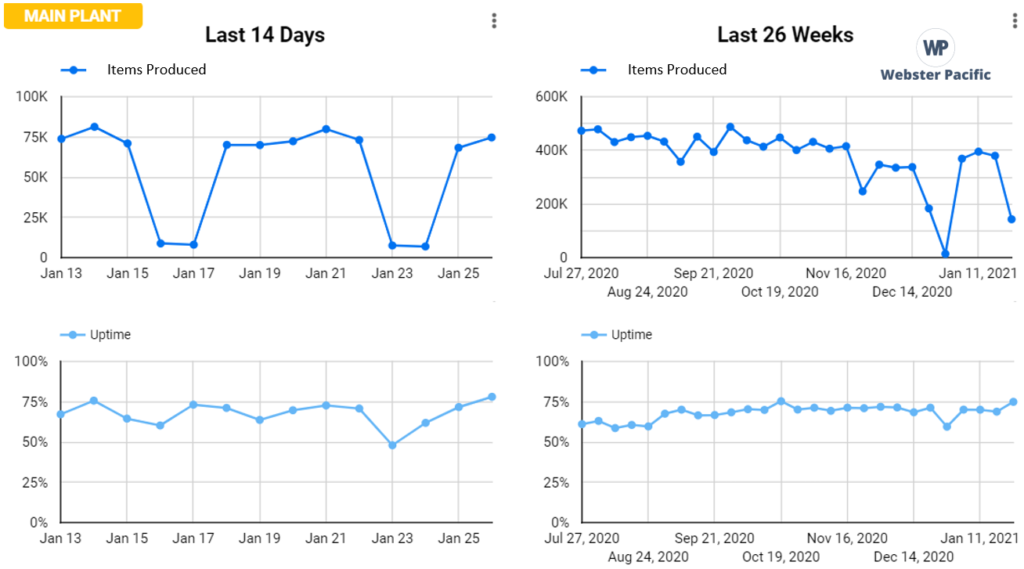
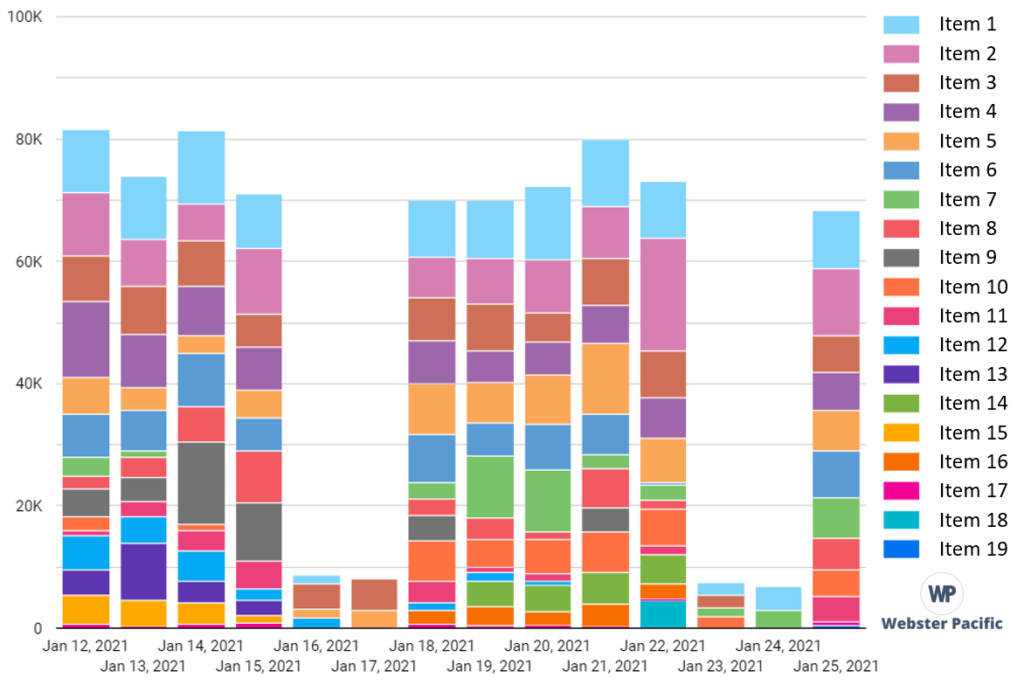
Many organizations struggle with gathering and reporting data. Writing information down on paper and sending excel sheets back and forth can lead to issues with data quality and privacy while making reporting almost impossible. Webster Pacific has developed efficient systems to get data into the cloud and then use it for reporting. Use cases have included 1) factory employees recording daily production, 2) vendors recording product specifications, 3) teachers recording test results, 4) executives recording business performance indicators. See example forms and reports below.
Custom Form and Reports
Webster Pacific continues to expand analytical capabilities for real estate investors of all asset classes. We gather data for our clients on demographics, income, competitive supply and alternative data like proximity to quality restaurants and transit. See below example of demographic data that a multi-family (apartments) investor may want to consider when investing in Philadelphia. You can also watch a video of Steve presenting the data here.

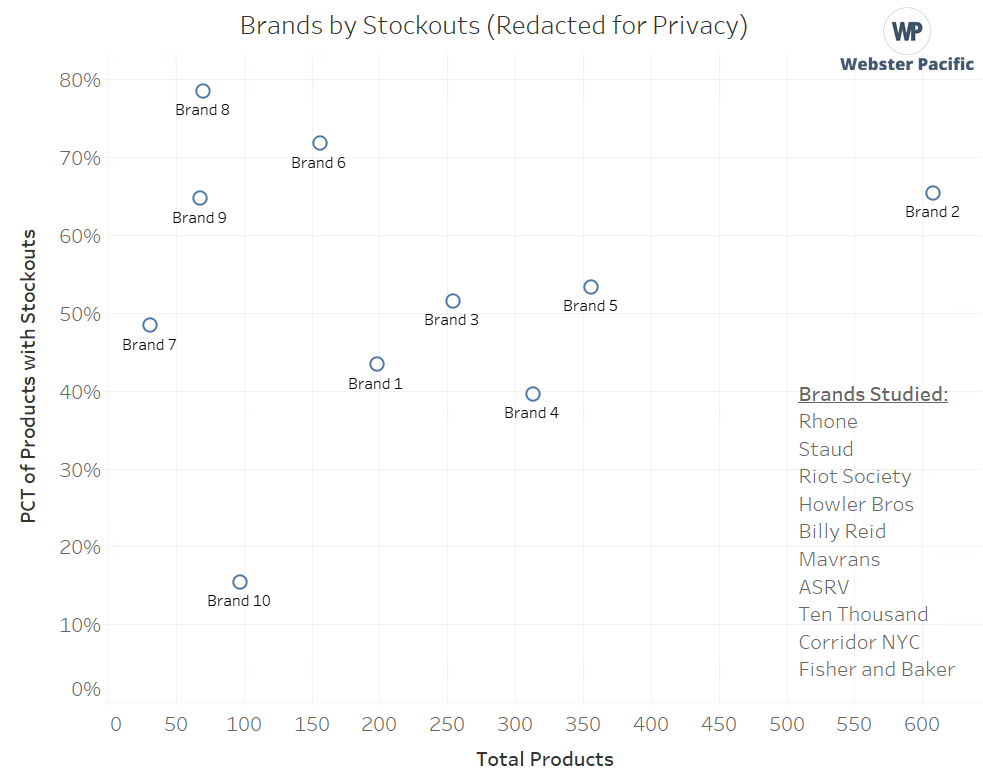
Because many of our clients are e-commerce companies, we were curious to know what level of stockouts are experienced by other e-commerce companies. We were quite surprised to find that 9 out of 10 companies we studied had 40% or more of their products stocked out. This would be like a grocery store having 4 out of 10 shelf spaces empty. We think this situation represents a significant revenue opportunity for e-commerce companies, and we have developed and implemented a solution.