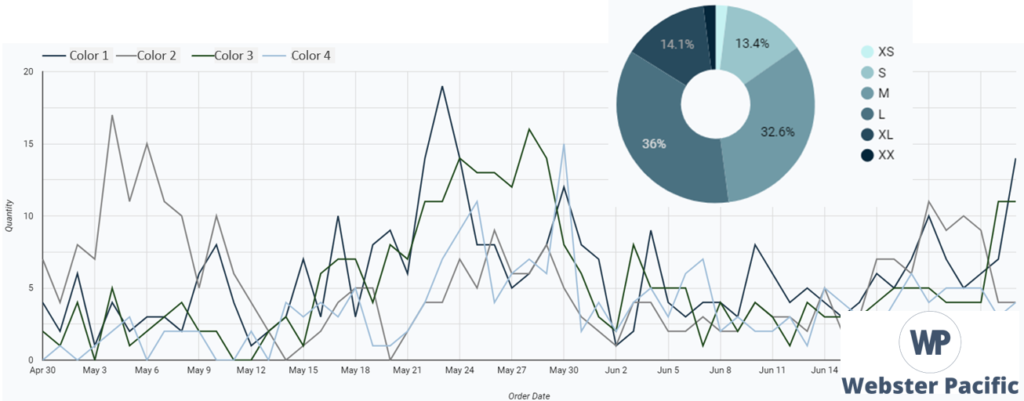
Client Question: How many units should we order, and when should we order to avoid stockouts?
Stockout and Inventory Forecasting
How many units should we order, and when should we order to avoid stockouts?
Manufacturing Reporting
How can we track key manufacturing metrics about the efficiency and throughput of our manufacturing facility?
Enrollment Funnel Analysis
How many applications must we receive in order to fully enroll our school?
Enrollment Predictions
What will our enrollment be, by school and by grade, next year so we can budget appropriately?
Stockout and Inventory Forecasting
Approach: Webster Pacific builds a tool using Google Data Studios that predicts, in real time, when each SKU (Stock Keeping Unit) will stock out. This tool pulls live inventory and sales data from the API of the client’s e-commerce tool, such as Shopify. WP then runs algorithms that consider recent 2, 4, or 8 week sales trends and uses seasonality to predict sales 26 weeks into the future. This data is then compared, by week, to the existing inventory and planned orders, by arrival date, to predict stockouts. The client can then use this information to make the right orders at the right times to avoid stockouts.
Manufacturing Reporting
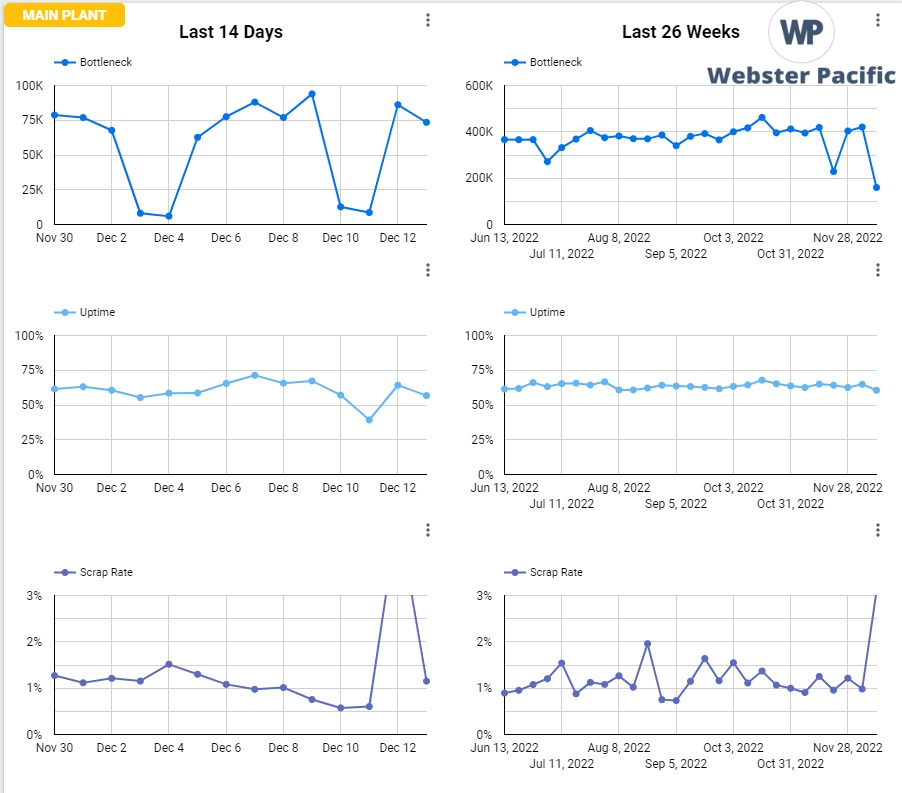
Client Question: How can we track key manufacturing metrics about the efficiency and throughput of our manufacturing facility?
Approach: WP starts with a system to collect and clean factory data, whether it be by connecting to an ERP system or building a custom form for operators to input data manually. Then, WP focuses on identifying metrics with leadership that are key for understanding factory performance, such as Uptime, Scrap, and Throughput. WP then builds succinct dashboards, delivered to a client’s inbox daily, to report on these metrics.
Enrollment Funnel Analysis
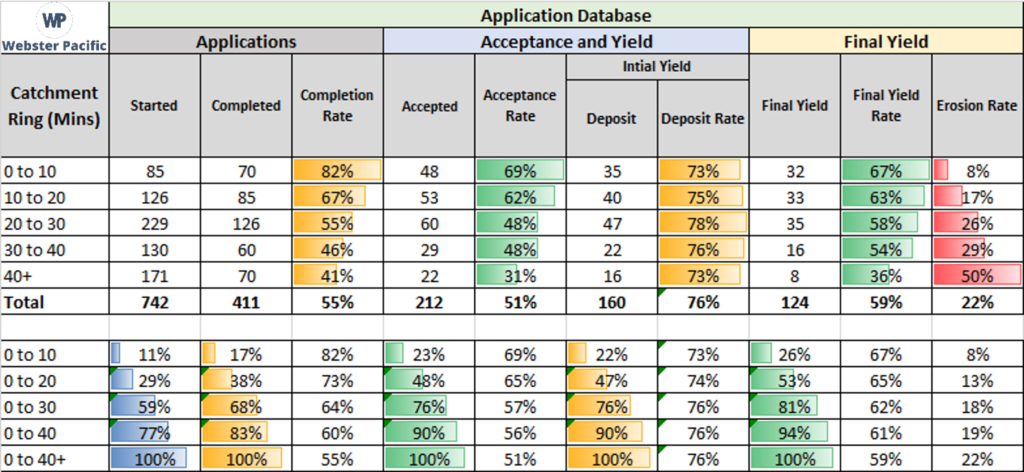
Client Question: How many applications must we receive in order to fully enroll our school?
Approach: Using historical data from our client’s school, Webster Pacific creates models for predicting how many applications a campus must receive in order to meet its target enrollment. These models include metrics such as acceptance rate, yield, and erosion. In the example, notice how yield decreases and erosion increases the farther away students live from school. We advise our client to decrease acceptance rates for students living far from campus for this reason.
Enrollment Predictions
Client Question: What will our enrollment be, by school and by grade, next year so we can budget appropriately?
Approach: WP studies cohort survival, external data, and attrition-based models to understand which best predicts future enrollment by studying our client’s historical enrollment data. This example is a piece of the attrition model that we use to predict enrollment for a particular school. To do so, we study the historical attrition rates via withdrawals, transfers, and dropouts. We use this data to predict enrollment, by grade, for the following year (highlighted in orange).


