12Oct
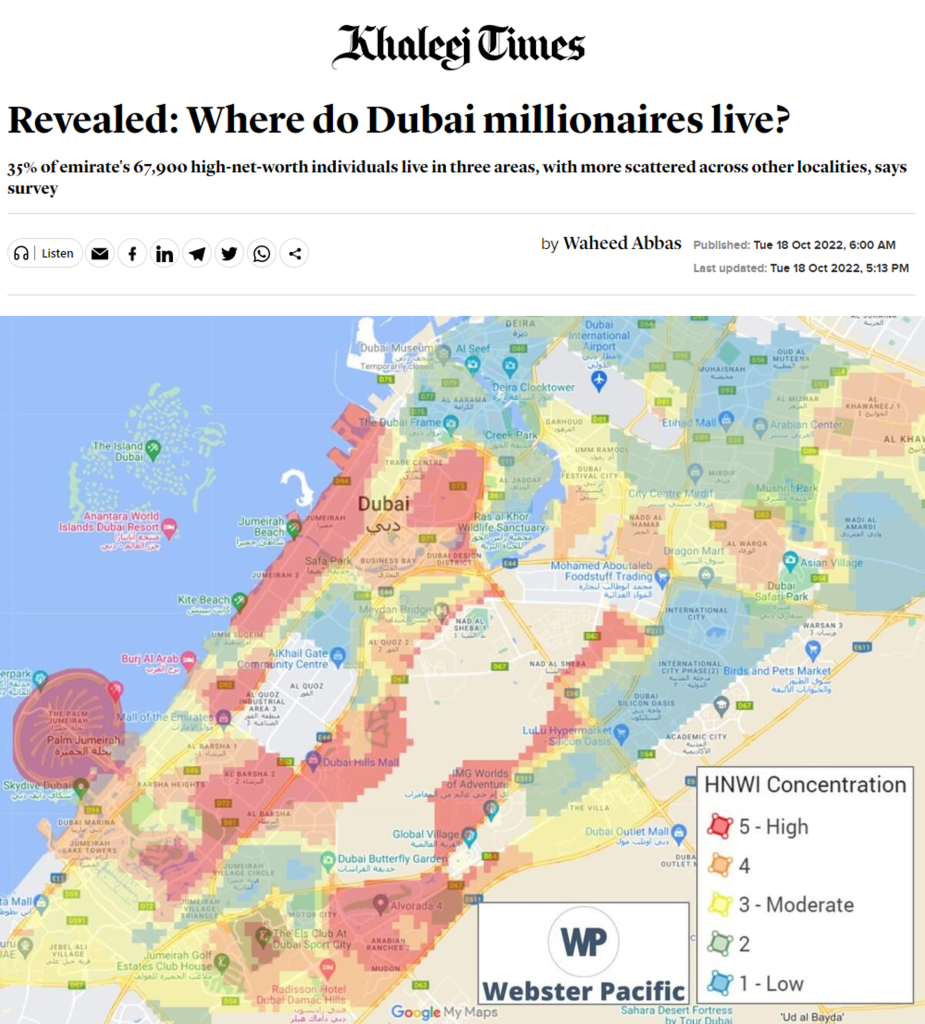
October 18, 2022: A Geospatial Study of High Net Worth Individuals in Dubai
ArticleLeave a comment

Full PDF report at this link. Interactive map at this link.

——————————————————————————————————————-

Introduction

This report is compiled by strategy consultancy Webster Pacific (www.websterpacific.com) using their proprietary analytics to map High Net Worth Individuals (HNWI) at the neighborhood level.  Total Dubai HNWI counts provided by intelligence firm New World Wealth (www.newworldwealth.com). HNWI are defined as individuals with wealth[1] of US$1 million or more, of which Dubai has 67,900 as of June 2022.

Research and Findings

Webster Pacific used proprietary analytics to make estimates the HNWI population of Dubai, geospatially.  See heat map below.  Additionally, estimates of the count of HNWI by residential area (similar to neighborhood) are shown in the table on page 3 of this report.

  • The top 5 residential areas with the highest count of HNWIs were 1) Jumeirah First, 2) Al Barsha, 3) Jumeirah, 4) Arabian Ranches, and 5) Al Thanyah. Detailed residential area borders on page 4.
  • Of the 67,900 HNWIs in Dubai, 35% are in Jumeirah First, Al Barsha, and Jumeirah.
  • Jumeirah is distinguished by its upscale, suburban feel and its proximity to both the gulf and downtown Dubai.
  • Al Barsha is ideal for wealthy families due to the abundance of schools such as GEMS Dubai American Academy and King’s School Al Barsha, along with access to elevated shopping at Galleria Mall Al Barsha.
  • Arabian Ranches and Al Thanyah offer more secluded communities with a multitude of world-renowned golf clubs and equestrian facilities.

[1] “Wealth” refers to the net assets of a person, including property, cash, equities, business interests, less liabilities.

Read More
26Oct
OCTOBER 29, 2020: COVID-19 IMPACT ON USA MOVING
PressLeave a comment

Download the full report via this link.

Executive Summary:

Webster Pacific and United Van Lines collaborated to better understand the impacts of Covid-19 on USA moving trends.  Using United Van Lines data, Webster Pacific studied moves by zip code and metro area over a two-year period across the contiguous United States.  This report finds that Covid-19 has caused people to move out of the largest metro areas, favoring smaller metro areas.  Additionally, people are moving out of New York/New Jersey and California at higher rates due to Covid-19 and moving into the South and the Midwest Plains.

Read More
05Aug
AUGUST 5, 2020: USA Wealth Report
PressLeave a comment

Download the full report via this link

Introduction

This report is compiled by location analytics specialists Webster Pacific (www.websterpacific.com) and wealth intelligence firm New World Wealth (www.newworldwealth.com). The wealth and HNWI figures in the report are for June 2020 and they therefore take into account the impact of the recent coronavirus outbreak.

Contents

  1. Introduction
  2. Benchmarking US wealth in context
  3. The wealthiest cities in the US
  4. USA luxury vacation index
  5. Spotlight on luxury residential estates
  6. The Coronavirus impact 1H 2020
  7. Wealth vs GDP
  8. Research and methodology
Read More
24Jun
JUNE 24, 2020: LUXURY RETAIL MARKETS PREDICTED TO BE MOST NEGATIVELY IMPACTED BY COVID-19
PressLeave a comment

Download the full report via this link.

Executive Summary

Covid-19 has dramatically impacted tourism and, in particular, international tourism. Certain luxury retail markets are more dependent upon tourism than others. Our analysis predicts that the luxury retail markets most negatively impacted by Covid-19 will be those markets with the greatest presence of luxury retail AND the greatest international tourism per capita. We predict that the luxury retail markets of Miami, Honolulu, and Las Vegas will be the most negatively impacted.

Read More
06Mar
MARCH 5 2020: MOBILE-PHONE DATA SHOWS VIRUS CRUSHING SOME RETAIL HOT SPOTS
ArticleLeave a comment

Written by Bloomber’s Jonathan Levin.  Published on Bloomberg on March 5, 2020 

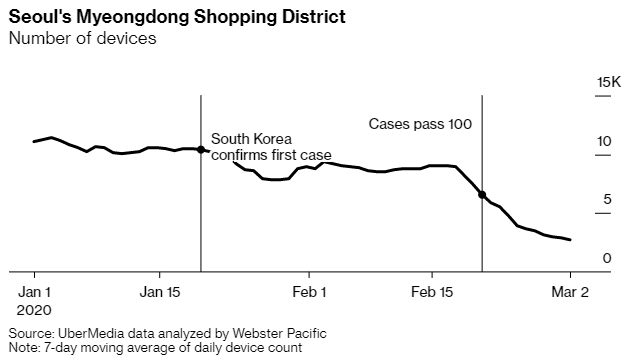
Mobile-phone data — a proxy measure for crowds — is showing just how dramatically some of the world’s retail hot spots have cleared out as coronavirus spreads.

In Seoul’s Myeongdong shopping district, mobile devices plummeted about 67% last weekend, compared to the weekend traffic four weeks earlier, according to UberMedia data analyzed by Webster Pacific.

Seoul Coronavirus

***You can read the rest of the article on Bloomberg via this link
Read More
18Oct
AUGUST 16 2019: WORLD CITIES 2019 WEALTH REPORT
PressLeave a comment

Wealth intelligence firm New World Wealth and location analytics specialists Webster Pacific recently reviewed the top cities worldwide by total wealth held. See top 20 below. As part of this study, Webster Pacific created heat maps for certain major cities to give a better indication of which neighborhoods are the wealthiest in each city.

Download Press Release: World cities 2019

Wealth Maps: London, Dubai, Mumbai

Coverage: Quartz, Khaleej Times 1, Khaleej Times 2

London_HNWIConc_v1

Read More
12Jun
JUNE 10, 2019: MAPS OF SAN FRANCISCO AT COVINGTON
EventsLeave a comment

A Pop-Up Exhibit on the Cartographic History of San Francisco at Covington & Burling, San Francisco: 53 maps, on the 53rd floor of the Salesforce Tower, from 1507 to present, that tell the story of San Francisco. Highlights include: first map of America, California as an island, the 1906 Earthquake, and the “fill” of San Francisco Bay.

Speakers: Jim Schein and Tom Paper

Google slide document of the maps included in the exhibit: via this link

Video of presentation by Tom Paper and Jim Schein (47 min): via this link

Video of maps as set up in the Covington offices in Salesforce tower (1 min): via this link

Read More
07Jun
June 7, 2019: HIGH-INCOME HOUSEHOLDS ARE MOVING INTO THE SOUTH SOUND. WILL GOOD-PAYING JOBS FOLLOW?
PressLeave a comment

Written by The News Tribune’s Debbie Cockrell. Published on The News Tribune on June 7, 2019.


TblViz_v2

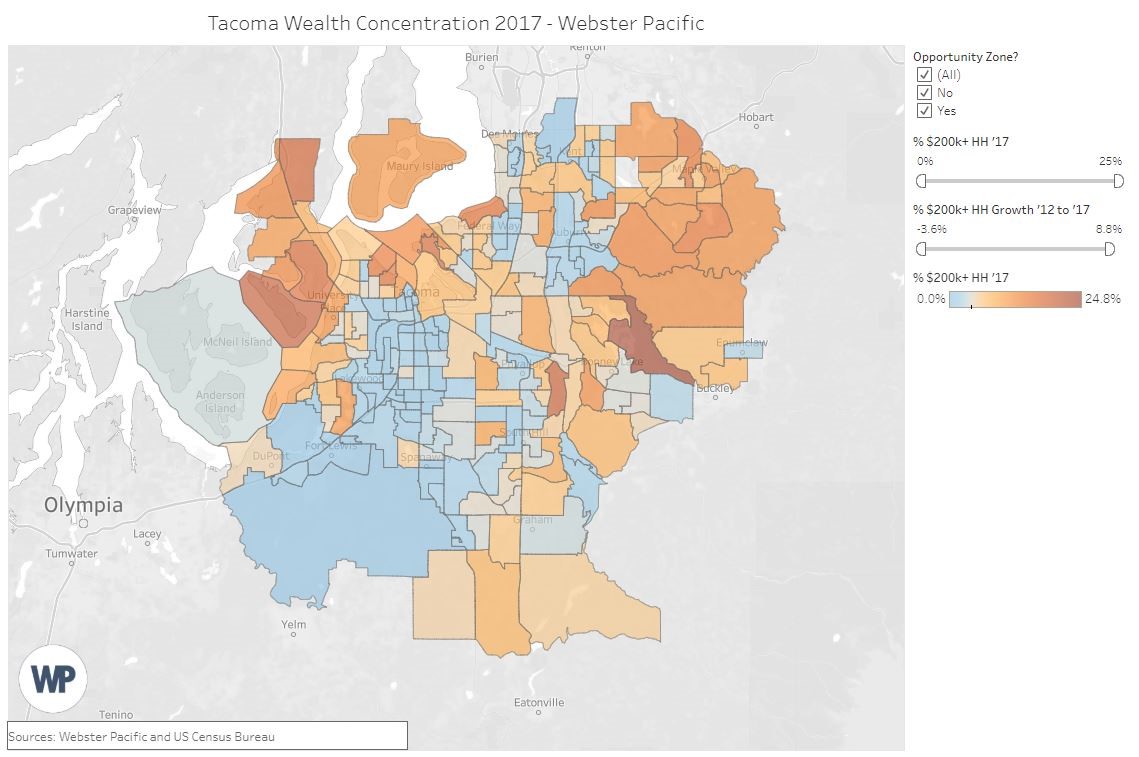
Portions of Pierce and South King County are getting wealthier.

From 2012 to 2017, the Tacoma metro and surrounding area, which includes some of South King County, have seen the number of high-earning households, those that make $200,000 a year or more, grow from 14,594 to 24,137.

That’s according to census data and numbers compiled by data and analytics consulting firm Webster Pacific, based in San Francisco.

Not all of the high-earning households are new, the researchers said. Some of them could have been in the area before 2012 and experienced wealth growth.

Yet, as Seattle’s housing market has continued to push more home buyers southward, some neighborhoods on the outskirts of Tacoma’s metro area have been among those to see the most growth since the market rebounded after the Great Recession.

The accumulation of wealth leads to affordability concerns and raises questions about what is happening to the local economy.

*You can read the rest of the article on The News Tribune, via this link.

Read More
07May
May 7, 2019: Finding the Top 50 Opportunity Zones for Real Estate Investment – Report
PressLeave a comment

Download the full report via this link.


***REPORT EXCERPT***

Finding the Top 50 Opportunity Zones for Real Estate Investment


To better understand an investment strategy in Opportunity Zones, Webster Pacific examined various data related to each zone in the United States and Puerto Rico. Our objective was to identify which Opportunity Zones represent places where the value of a property investment would most likely continue to increase. To that end, our analysis of real estate values has shown that incomes and wealth correlate strongly with real estate value. We therefore asked the following question: “Of all 8,700 Opportunity Zones, where are incomes and wealth already growing the most?”

To answer this, we calculated the growth in the percentage of households earning $200,000 or more in each of the 8,700 Opportunity Zones. (The growth is measured between 2000 and 2017 and is adjusted for inflation. We excluded any tracts that were recently created, tracts whose boundaries were significantly altered, or tracts with fewer than 100 households. A similar methodology was used in one of our earlier studies, released in an article by Bloomberg[2].) We then found the fifty Opportunity Zones with the highest wealth growth and mapped them in Tableau by metropolitan area.

PressRelease_IMAGE_CBSAs

***Download the full report via this link.

News Features:

Publication Link
The Real Deal
Bloomberg
Globe St
PropModo
Crain’s NY
Crain’s Cleveland
Crain’s Chicago Business
The Real Deal
GreenPointers Blog
Qualitas Properties
Yahoo Finance
Forbes
1 First Class Homes
Crain’s NY
Read More
16Apr
April 18, 2019: Pop-up Exhibit: 45 Maps of San Francisco
EventsLeave a comment

45 maps, from 1507 to present, that tell the story of San Francisco.  Highlights include: first map of America, California as an island, the 1906 Earthquake, and the “fill” of San Francisco Bay.

Speakers:  Jim Schein and Tom Paper

PPT Presentation: via this link

Photos: via this link

Videos: Part 1, Part 2, Part 3

Read More