Download the full report via this link.
***REPORT EXCERPT***
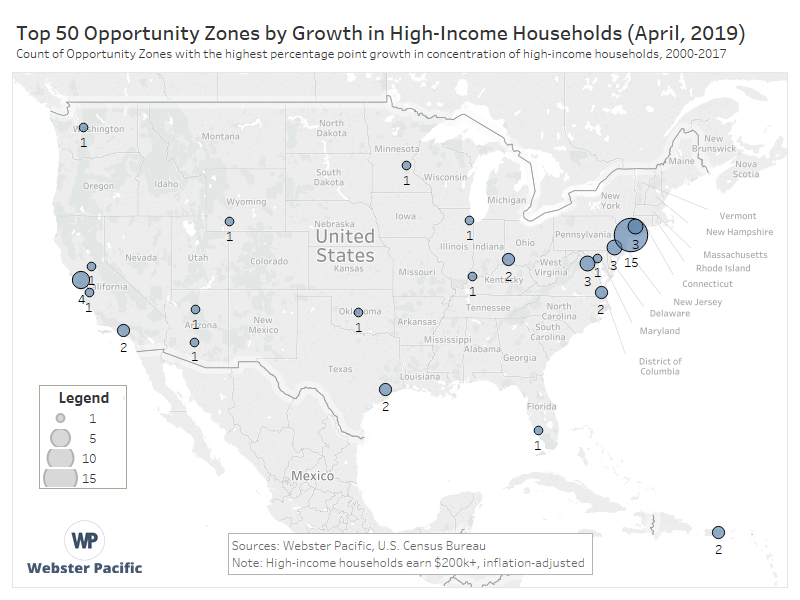
Finding the Top 50 Opportunity Zones for Real Estate Investment
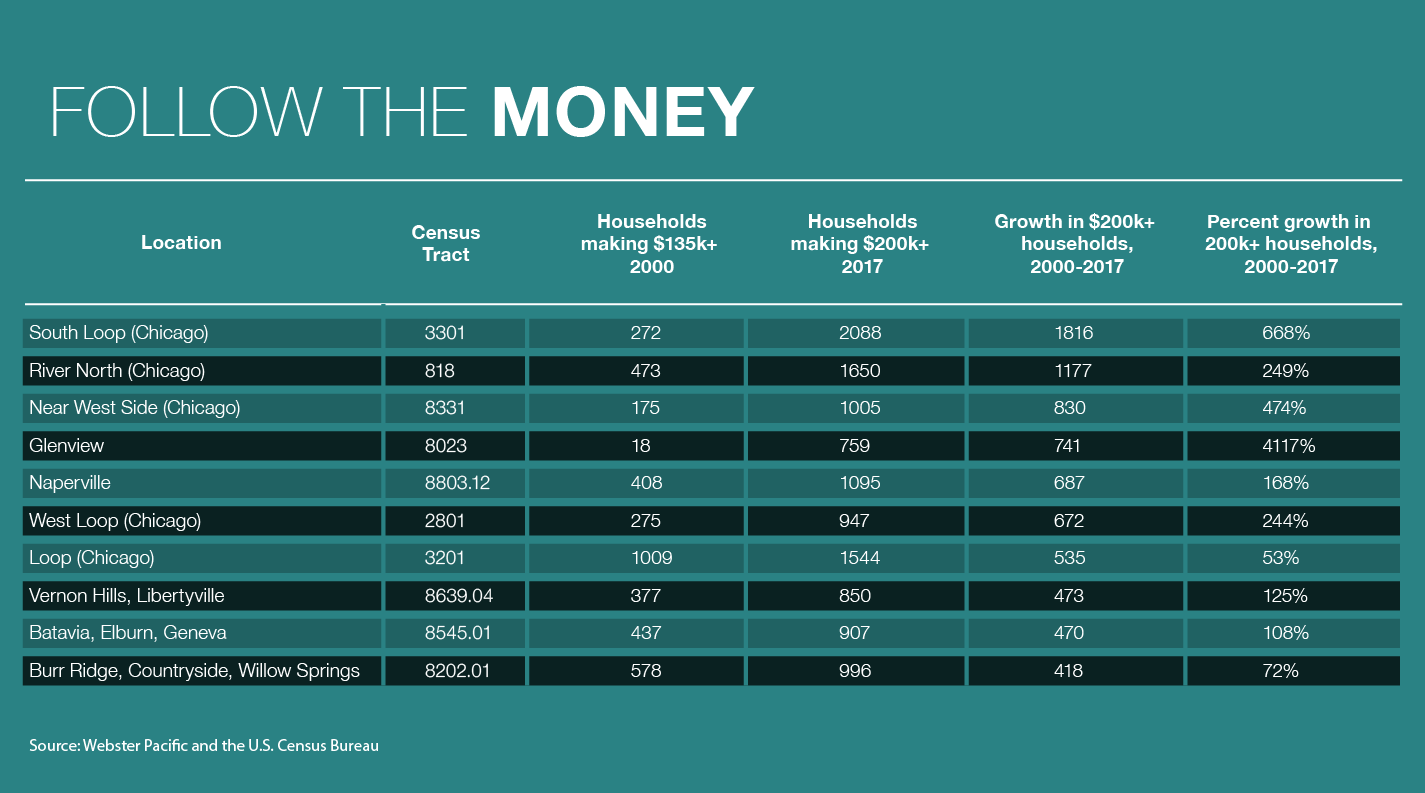
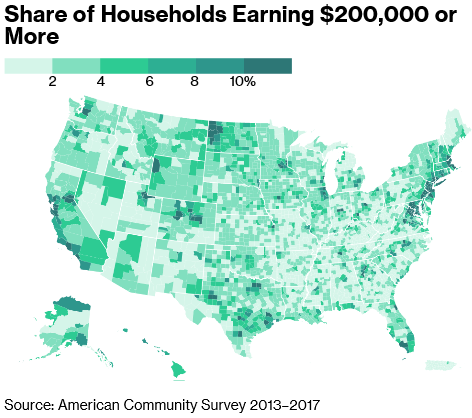
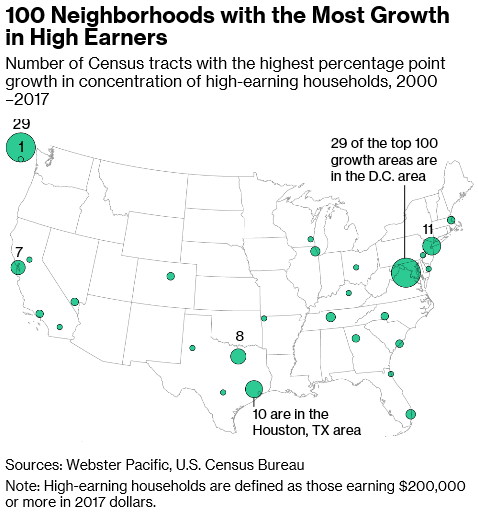
To better understand an investment strategy in Opportunity Zones, Webster Pacific examined various data related to each zone in the United States and Puerto Rico. Our objective was to identify which Opportunity Zones represent places where the value of a property investment would most likely continue to increase. To that end, our analysis of real estate values has shown that incomes and wealth correlate strongly with real estate value. We therefore asked the following question: “Of all 8,700 Opportunity Zones, where are incomes and wealth already growing the most?”
To answer this, we calculated the growth in the percentage of households earning $200,000 or more in each of the 8,700 Opportunity Zones. (The growth is measured between 2000 and 2017 and is adjusted for inflation. We excluded any tracts that were recently created, tracts whose boundaries were significantly altered, or tracts with fewer than 100 households. A similar methodology was used in one of our earlier studies, released in an article by Bloomberg[2].) We then found the fifty Opportunity Zones with the highest wealth growth and mapped them in Tableau by metropolitan area.
***Download the full report via this link.
News Features:
| Publication | Link |
| The Real Deal | |
| Bloomberg | |
| Globe St | |
| PropModo | |
| Crain’s NY | |
| Crain’s Cleveland | |
| Crain’s Chicago Business | |
| The Real Deal | |
| GreenPointers Blog | |
| Qualitas Properties | |
| Yahoo Finance | |
| Forbes | |
| 1 First Class Homes | |
| Crain’s NY |