Webster Pacific’s work starts with a client’s strategy, their unique combination of market position and choices about operational activities. Every client’s strategy is different and we seek a deep understanding for how each client defines success so that we can best translate that understanding into geo-spatial insights.  We serve clients in the Retail, Fitness, Education, and Real Estate industries.

We have developed a unique and robust capability to help our clients quantitatively assess optimal locations for their physical sites and marketing efforts. Using GIS software, transportation networks, WP’s Asset Band and Population Data Blocks, mobile data, foot-traffic data, competitor data, POI, and our client’s internal data, we have mapped and analyzed over forty cities around the world.

CASE STUDIES

Market Expansion Strategy

Question: Which cities should we expand to next?  How many locations can each market support?  How far have we penetrated each market in terms of sales?

Approach:  We collected a variety of metrics on major metropolitan area in the world (redacted example at right).  We then worked iteratively with our client to identify the metrics of highest importance, which included: e-comm and wholesale sales, number of target customers “demand” from an income and demographics perspective, complexity of the regulatory environment, and presence of competitors.

Result: We identified markets that had a significant number of target customers (aka demand), which we then compared to the number of existing customers from an e-commerce and wholesale perspective.  We then converted these estimates using a customer per store ratio to identify the number of locations that each market could support.

Retail Neighborhood Selection

Question: In which retail neighborhoods should we locate?

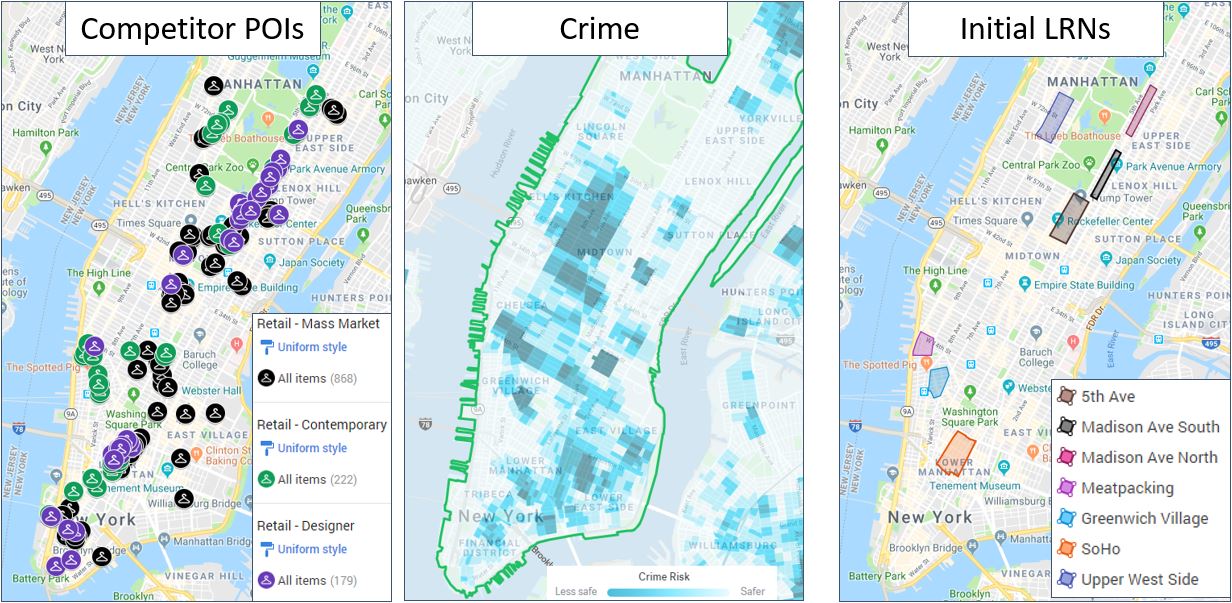
Approach: We first mapped data that supported our client’s retail strategy.  For this example, the client wanted to be located in luxury retail neighborhoods (LRN) that had a presence of either designer or contemporary fashion retailers and were low in crime (see NYC example at right).  Next we built a model that aggregated and compared data about every LRN across each market. Data inputs to the model included: mobile data, proximity to target customer, tourism, crime, presence of POI, and existing e-comm/wholesale sales (see example of the Fillmore LRN in San Francisco at right).  The model used weightings and indices to rank the importance of each input to create a total score for each LRN across every market (see model comparison table at right).

Result: 5th Avenue in NYC received the highest overall score, which our client then chose for their next store opening.

Site Quality Comparison

Question: How do we compare the quality of two prospective sites that are just a block away?

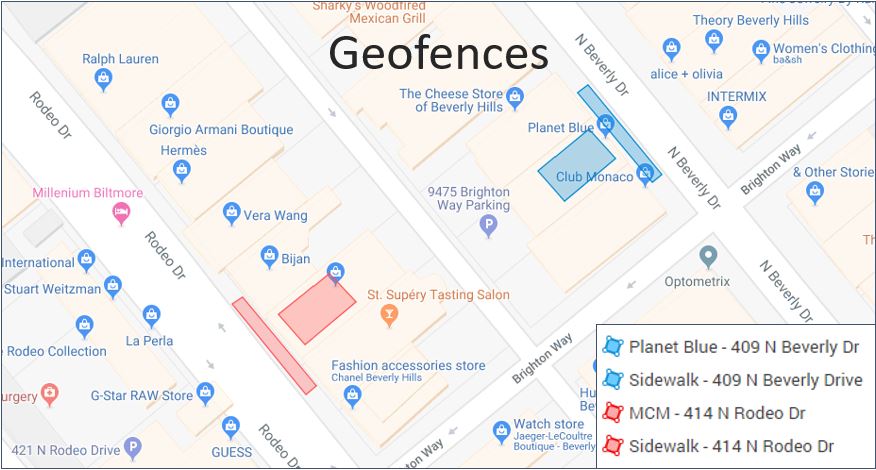
Approach: For a contemporary fashion client, we evaluated two sites in the Rodeo Drive neighborhood of Los Angeles.  To assess the quality of these two sites, we first used mobile data to 1) understand the foot traffic on the sidewalks in front of each site and 2) understand the retail traffic for existing stores near the sites in question.  Second, we considered the businesses that were immediately next to each site (the strategy of our client was to locate close to their competitors to attract a similar customer).  All of this data was then compared to the asking rent for each prospective site.

Result: The Rodeo Drive site had an asking rent that was two times that of the Beverly Drive site.  Though the Rodeo Drive site had more foot traffic, the number of visitors in the store of a prior tenant was the same as the Beverly Drive site, suggesting that most of the sidewalk traffic on Rodeo Drive is composed of window shoppers.  Also, 4 of 5 proximal stores to the Beverly Drive site were in contemporary fashion, which was favorable for the client, compared to the 5 of 5 designer stores that were proximal to the Rodeo Drive site.  From a perspective of rent, POI, and mobile data, we concluded that the Beverly Drive site was favorable.

Private School Campus Placement

Question: Where should a client locate its schools in new markets?

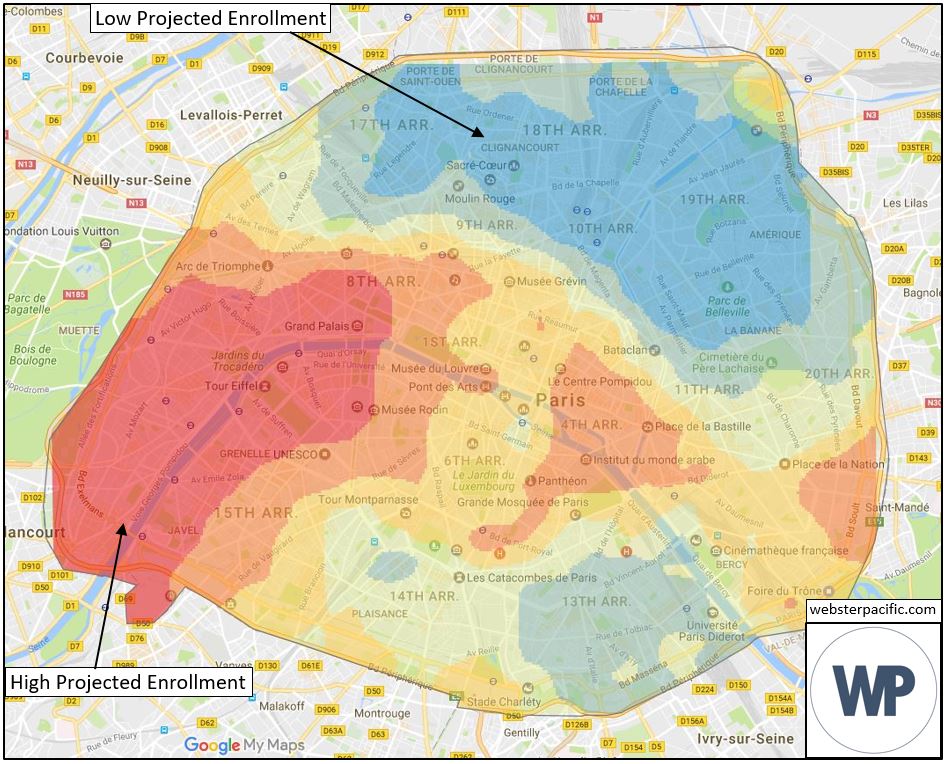
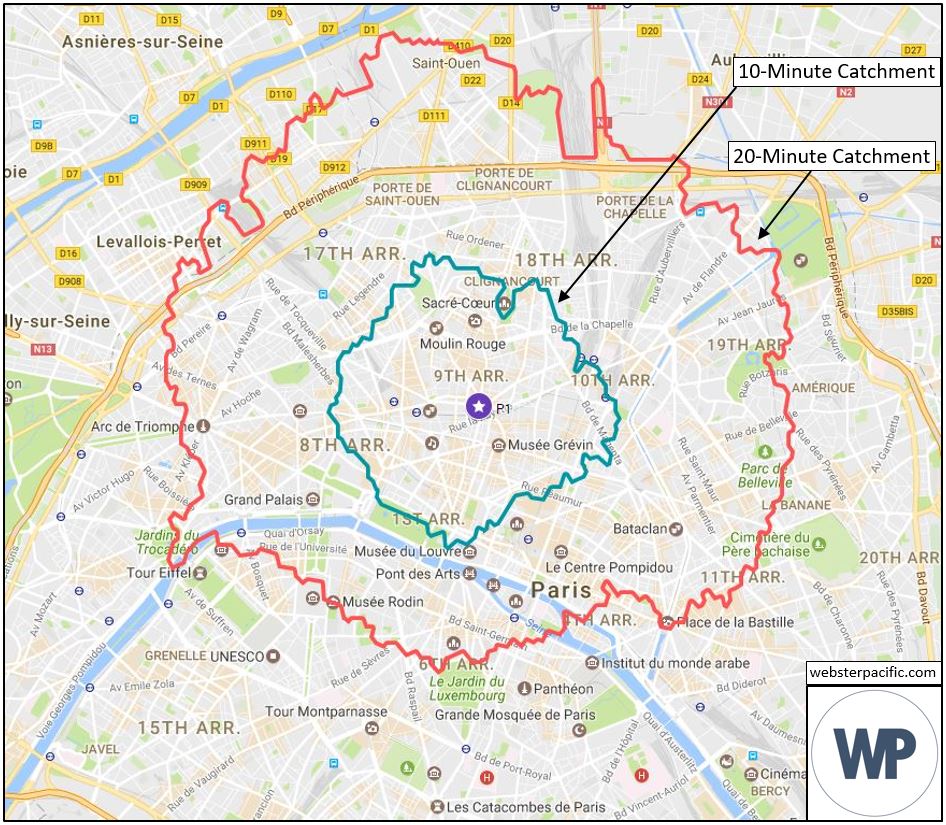
Approach: Webster Pacific developed an analytical system to understand both demand and supply within a given drive time for all the neighborhoods in a market. This analysis, called “Demand-Supply-Catchment,” is a systematic process whose goal is to find locations where maximum enrollment can be expected. The process depends upon analysis of demand with appropriate demographics and wealth data; supply is analyzed using the seats of competitive schools in the market. Demand and supply are then combined for various locations under consideration with “catchments,” which are drive time rings around particular locations. The outputs are maps, built in ArcGIS, which are also added to Google My Maps for easy access by the client when visiting sites in the market.

Result: Client uses the Demand-Supply-Catchment system to direct its site selection and on-the-ground business development efforts. The client is confident that their search efforts are directed towards the best locations.

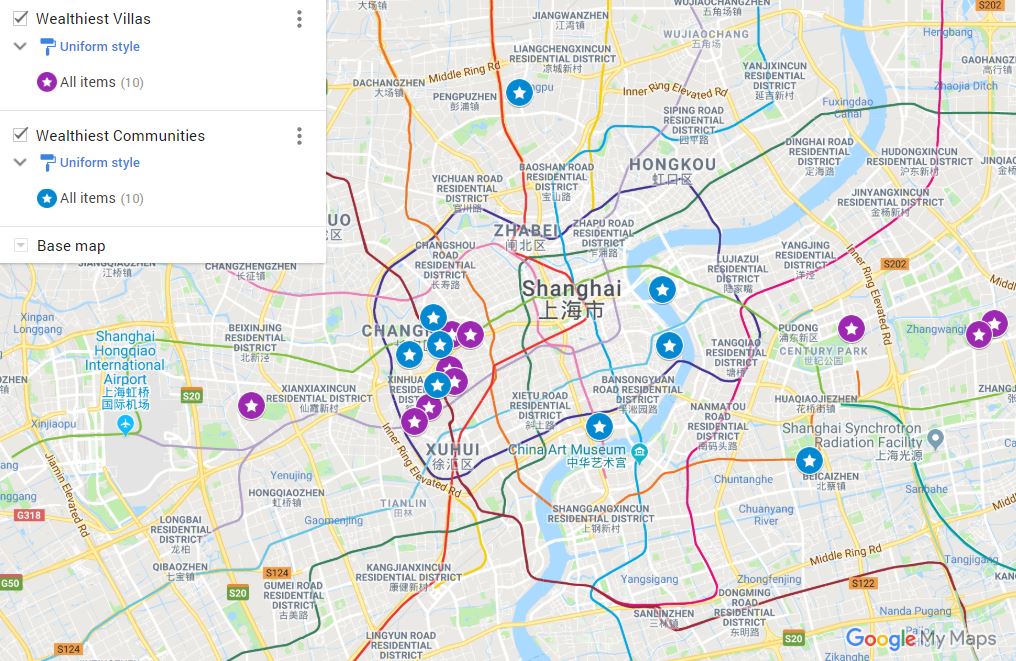
Advertising to HNWI for Luxury Retailer

Question: Where do our target customers (High Net Worth Individuals) live in China and how can we reach them with advertisements?

Approach: Webster Pacific used their Asset Band and Population Data Blocks combined with their in-house real estate data set to isolate the 10 most exclusive villas and the 10 most exclusive communities (groups of condominiums) in Shanghai and Shenzhen.  We then developed a plan to do targeted advertising using 1) the TV screens in the elevators of these communities and 2) geofencing to put advertisements on the mobile phones of the residents.

Result: Our client was able to successfully reach their target customer and reach their target clients.

Wealth Growth Maps

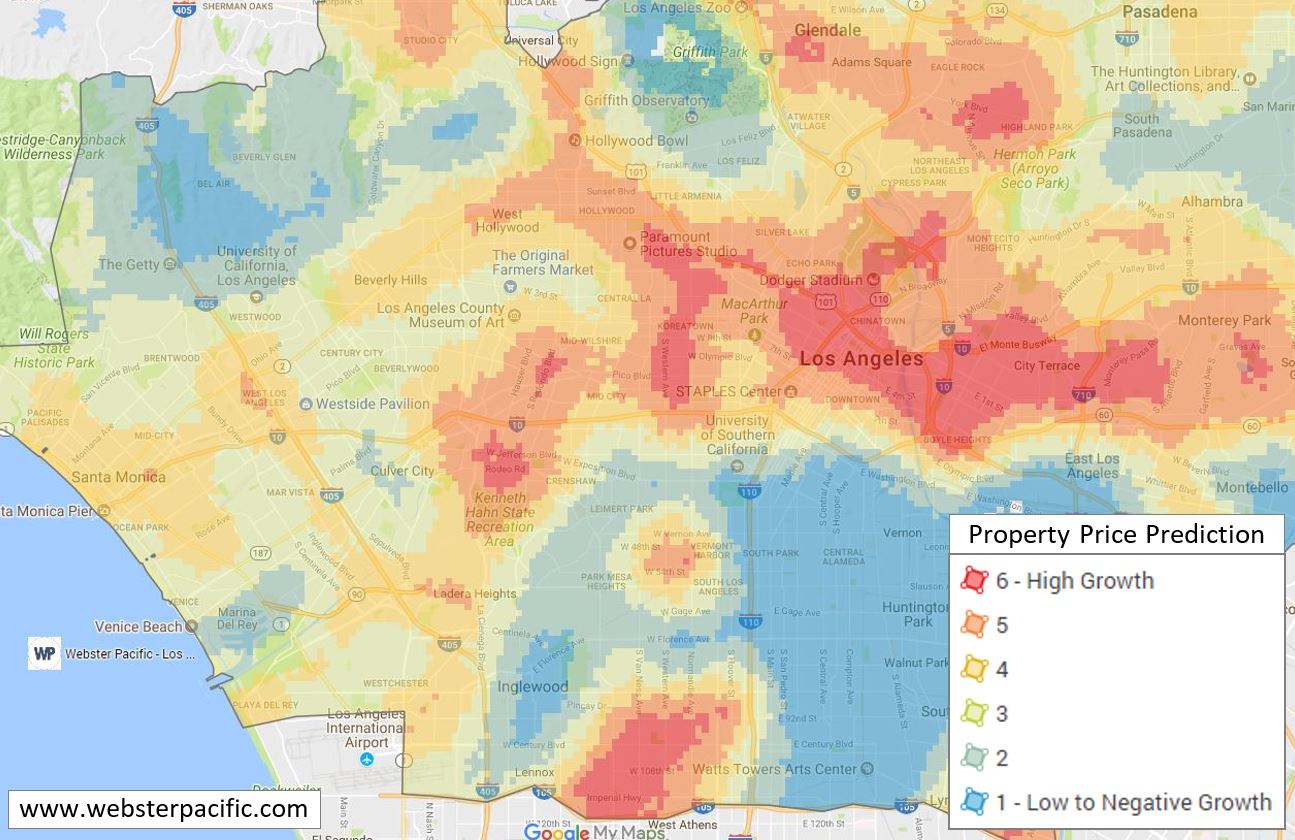
Question:  In which neighborhoods is wealth increasing most quickly?

Approach:  We developed the wealth growth maps, which estimate where wealth of all income levels is increasing in a city.  These maps are based on proprietary analytics and publicly available data. The analysis uses historical census data about income, households and population, and is backtested with recent real estate prices. This information is then organized on a drive-time basis and then displayed in the form of a heat map.

Result:  The client factored these insights into their commercial real estate investment decision-making for 5 markets across the United States.